HCA Healthcare Reported Solid Q1’26 Earnings Despite Muted Volume Growth
- May 3
- 2 min read
HCA’s Q1’26 financial performance was solid, supported by revenue growth, strong free cash flow generation, healthy interest coverage, stable leverage and robust liquidity. However, adjusted EBITDA margin declined by 48bps YoY, with ongoing concerns around the unfavorable margin impact from the expiration of enhanced premium tax credits (EPTCs)
Financial Performance Snapshot

Key Highlights:
Revenue increased by 4.3% YoY to $19.1B, driven by increase in revenue per equivalent admission (+3.1% YoY)
Muted growth in equivalent admission +1.1% YoY, due to decrease in seasonal respiratory-related activity coupled with impact of winter storm in key markets like Texas and Florida
Estimated cost of uncompensated care increased ~19% YoY to ~$1.25B, driven by a rise in uninsured admissions (+15.6% YoY), reflecting the impact of the EPTCs
Q1’26 – Earning Summary
Revenue
Total Revenue increased to $19.1B (+4.3% YoY, +4.5% YoY same facility), driven by increase in revenue per equivalent admission (+3.1% YoY, +3.1% YoY same facility), coupled with muted growth in equivalent admission (+1.1% YoY, +1.3% YoY same facility)
Third-Party Revenue Mix
Higher revenue contribution from lower margin Medicaid; contributed 7.6% to total revenue vs 6.5% in Q1’25
Lower revenue contribution from higher margin Managed care and insurers; 47.5% of total revenue vs 49.3% in Q1’25
Admission (Volume)
Consolidated admission increased by 0.7% YoY (+0.9% YoY same facility)
Inpatient and outpatient surgical volume declined; -0.4% YoY (-0.3% YoY same facility) and -2.7% YoY (-1.7% YoY same facility), respectively
Volume was negatively impacted by a 42.0% YoY decline in respiratory-related admissions, reflecting lower seasonal activity, along with weather-related disruptions in January 2026
Uninsured Admission
Consolidated and same facility uninsured admissions increased by 15.6% YoY & 15.5% YoY, due to the expiration of EPTCs and a decline in Medicaid conversions
Company Adj. EBITDA
Company adjusted EBITDA came in at $3.8B (+1.8% YoY), with margin of 19.9% vs 20.4% in Q1’25
The decline in margin was driven by an increase in other operating expenses as a percentage of revenue, primarily reflecting higher state supplemental Medicaid program expenses, increased professional fees, and higher technology investments. This was partially offset by lower supplies and salaries and benefits expenses
FCF
Generated free cash flow of $895M, post capex of $1.1B, cash interest of $573M and working capital use of ~$1.4B
Working capital was a headwind due to higher receivables and payer mix pressures
Pro Forma Leverage and Liquidity (as of April’26)
Gross debt/EBITDA of 3.1x and liquidity of ~$5.2B, including cash & cash equivalents of $940M and ~$4.3B availability in revolver
The company also announced plans to raise ~$4.0B of unsecured notes to refinance upcoming maturities and for general corporate purposes
Other Operating Metrics
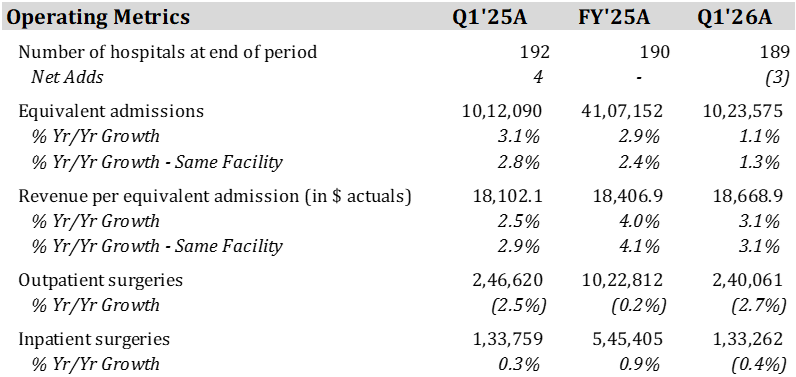
Equivalent admissions: Combined inpatient and outpatient volume
Revenue per equivalent admission: Revenue the hospital earns per unit of patient activity (adjusted for both inpatient and outpatient care)
Outpatient surgeries: Represents the number of surgeries performed on patients who were not admitted to HCA hospitals
Inpatient surgeries: Represents the number of surgeries performed on patients who have been admitted to HCA hospitals


Comments